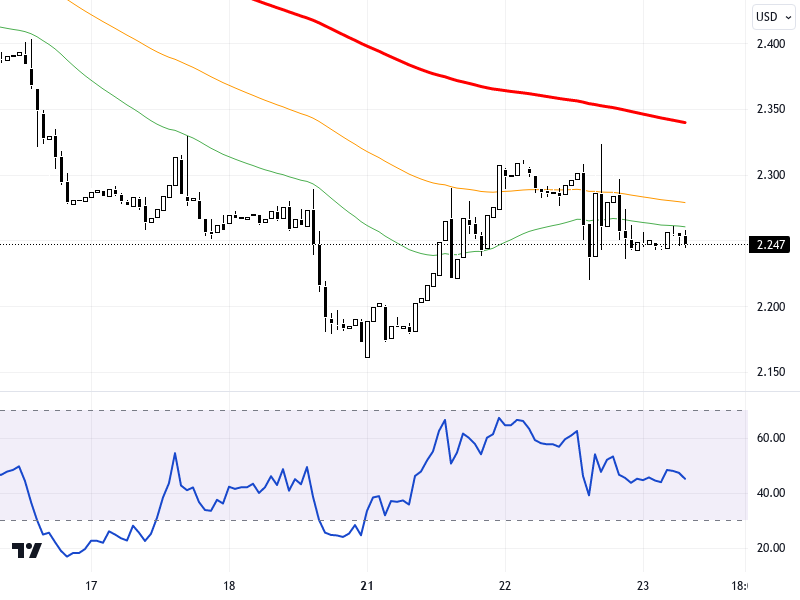
NGCUSD
U.S. natural gas futures continue to find direction amid fluctuations in weather conditions. Despite the expected temperature increases at the beginning of November, the anticipated cooling in the following week and the expected decline in production are supporting prices. Fluctuations in the natural gas market may be observed depending on the performance of U.S. and European stock markets. In this process, keeping natural gas prices above the support levels of 2.820 – 2.850 may support an upward trend.
Technically, the NGCUSD pair is examined on the hourly timeframe in the current chart. The pair points to resistance levels of 2.91 and 2.94 in upward movements, with the target being the 2.97 level if these levels are surpassed. In downward movements, support levels of 2.85, 2.82, and 2.78 should be monitored. The RSI indicator is currently at the 40 level, displaying a negative outlook. Compared to the previous day, the pair experienced a 0.18% decrease.
Support :
Resistance :


