NDXUSD
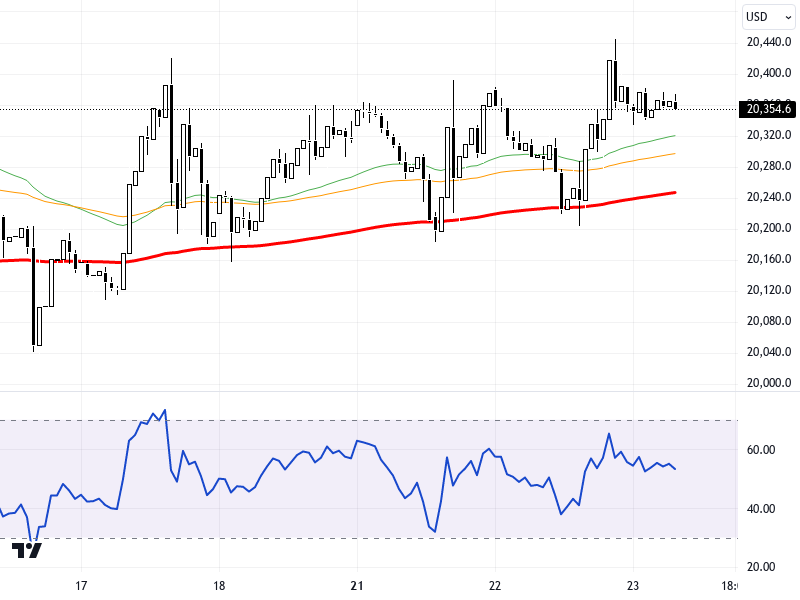
The NASDAQ100 index pulled back slightly after its recent rises, with the effort to hold above the 4.20% level of 10-year treasury bond yields putting pressure on the index. Existing home sales data from the US could impact index pricing. Markets are closely watching how these data could shape the index's movements. Overall, it is noted that the NASDAQ100 is trading in an area supported by current technical indicators.
On the chart, when examining the NASDAQ100 index on a 4-hour timeframe, the effort to hold above the 20350-20500 support zone is noteworthy. As long as this zone is maintained, upward movements could target resistance levels of 20650 and 20750. The RSI indicator displays a neutral appearance at the 47 level. It is observed that the index had a slight pullback of 0.02% compared to the previous day. If the downward trend increases, pricing below the 20350 support could pave the way for a movement towards the 20250 and 20150 levels.
Support :
Resistance :


