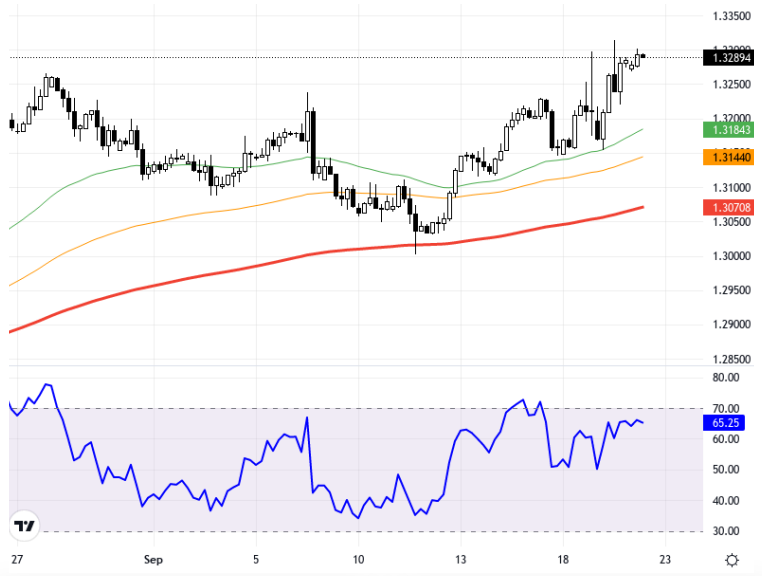
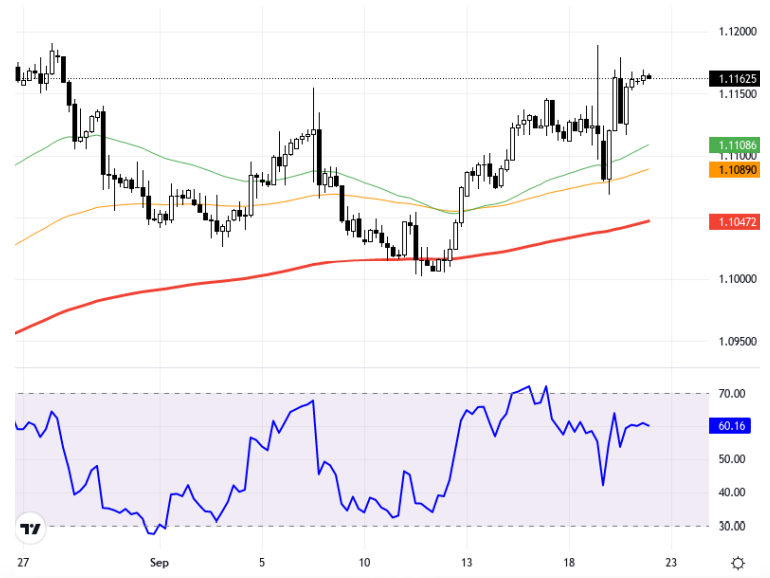
Daily News 20 09 2024

Important News of the Day

Zaman Önem Ülke Olay Beklenen Önceki Açıklanan
02:00 England (GBP) Core Retail Sales (YoY) (Aug) 1.1% 1.4%
02:00 Germany (EUR) German PPI (MoM) (Aug) 0.0% 0.2%
08:30 Canada (CAD) Core Retail Sales (Mom) (Jul) 0.2% 0.3%
11:00 Europe (EUR) ECB President Lagarde Speaks
14:00 USA (USD) FOMC Member Harker Speaks

EURUSD

Günlük Bülten

The EUR/USD pair continues towards the end of the week with limited volatility during a period when more information is being obtained about the roadmap of major central banks. As central banks like the Fed, ECB, BoE, and BoJ conclude their monetary policies, uncertainty regarding the next steps diminishes in the markets, making the impact of data on the economic calendar significant. The dollar index, on the other hand, remains in a longterm negative trend, maintaining its low levels. This could potentially create an advantage for the euro. In technical analysis, the pair is trading at the 1.1106 level on the 4-hour chart. Moving towards the 1.1150 resistance level, surpassing this level could provide new upward momentum towards the 1.1200 barrier. In potential pullbacks, the 1.1106 and 1.1089 support levels should be monitored. The RSI indicator is at 60.22, showing a positive outlook. According to yesterday's price movement, the pair has shown a 0.02% decrease. Currently, the pair is observed to be trading at the 1.1106 level. Support:1.115 - 1.11 - 1.104 - Resistance:1.12 - 1.124 - 1.1275 -

EUR/USD paritesi, haftanın sonlarına doğru volatilitesi sınırlı kalarak, majör merkez bankalarının yol haritasına dair daha fazla bilginin edinildiği bir dönemde devam ediyor. Fed, ECB, BoE ve BoJ gibi merkez bankalarının para politikalarını tamamlamasıyla birlikte, piyasalarda bir sonraki adımlara dair belirsizlik azalırken, ekonomik takvimdeki verilerin etkisi önemli hale geliyor. Dolar endeksi ise uzun vadeli bir negatif trend içerisinde kalarak, düşük seviyelerini korumaya devam ediyor. Bu durum, euro üzerinde potansiyel bir avantaj oluşturabilir. Teknik analizde, parite 4 saatlik grafikte 1,1106 seviyesinde işlem görüyor. 1,1150 direnç seviyesine doğru bir hareket izlerken, bu seviyenin aşılması 1,1200 bariyerine doğru yeni bir yükseliş ivmesi sağlayabilir. Olası geri çekilmelerde, 1,1106 ve 1,1089 destek seviyeleri takip edilmeli. RSI göstergesi 60.22 seviyesinde olup, pozitif bir görünüm sergiliyor. Dünkü fiyat hareketine göre parite %0,02 düşüş göstermiş durumda. Güncel durumda paritenin 1,1106 seviyesinden işlem gördüğü gözlemleniyor. Destek:1.115 - 1.11 - 1.104 - Direnç:1.12 - 1.124 - 1.1275 -

GBPUSD

Günlük Bülten

The GBP/USD pair is finding direction lately through major central banks' monetary policy announcements and economic data. Interest rate policies of banks such as the Fed, BoE, and BoJ play a decisive role for global markets, while the dollar index is trading between the range of 102.00 - 101.48, indicating a short-term bearish trend in the US currency. Retail sales data from the UK and BoE communications could have an impact on the pound. In light of global developments, we are in a period where market participants are closely watching the next steps of central banks. From a technical perspective, the chart is on a 4-hour timeframe. The GBP/USD pair is rising towards the 1.3315 resistance, and moves above this level could support further upward potential. In downward movements, the levels of 1.3140 and 1.3070 should be monitored as support. The RSI indicator is at 65, showing a positive outlook, which suggests the potential for price increases. The pair changed by 0.02% compared to the previous day, and the current price is at the 1.3289 level. Support:1.3265 - 1.322 - 1.318 - Resistance:1.3315 - 1.3355 - 1.34 -

GBP/USD paritesi, son dönemde büyük merkez bankalarının para politikaları açıklamaları ve ekonomik verilerle yön buluyor. Fed, BoE ve BoJ gibi bankaların faiz politikaları, küresel piyasalar için belirleyici rol oynarken, dolar endeksi 102,00 - 101,48 aralığında seyrediyor, bu da ABD para biriminde kısa vadeli düşüş eğilimini gösteriyor. İngiltere'den gelecek perakende satış verileri ve BoE iletişimleri ise sterlin üzerinde etkili olabilir. Küresel gelişmeler ışığında, piyasa katılımcılarının merkez bankalarının bir sonraki adımlarını dikkatle izledikleri bir dönemdeyiz. Teknik açıdan bakıldığında, grafik 4 saatlik zaman dilimindedir. GBP/USD paritesi, 1,3315 direncine doğru yükselmekte olup, bu seviyenin üzerindeki hareketler daha fazla yukarı yönlü potansiyeli destekleyebilir. Aşağı yönlü hareketlerde ise 1,3140 ve 1,3070 seviyeleri destek olarak izlenmelidir. RSI göstergesi 65 seviyesinde ve pozitif bir görüntü sergiliyor, bu da fiyatların yükselme potansiyeline işaret ediyor. Parite, önceki güne göre %0,02 oranında değişti ve mevcut fiyat 1,3289 seviyesinde bulunuyor. Destek:1.3265 - 1.322 - 1.318 - Direnç:1.3315 - 1.3355 - 1.34 -

USDTRY

Günlük Bülten

Despite the divergence of emerging market currencies against the US Dollar, the USD/TRY pair continues its weak trend. Following the Fed's interest rate decision, the perception in the markets that the US labor market is showing moderate slowdown is putting pressure on the dollar. This situation supports the pair trading at the 34.08 level. Geopolitical and economic uncertainties are limiting the strength of the Turkish Lira. In technical analysis, the first support levels observed in the 4-hour chart time frame are 33.96 and 33.80, while the resistance levels are 34.12 and 34.22. The RSI indicator is at 56, showing a positive trend. The USD/TRY pair is at 34.07, with a slight increase of 0.0087% compared to the previous day. Especially breaking above the 34.22 resistance could support upward movements of the pair. Support:33.96 - 33.88 - 33.8 - Resistance:34.12 - 34.22 - 34.3 -

USD/TRY paritesi, gelişmekte olan ülke para birimlerinin ABD Doları karşısındaki farklılaşmasına rağmen, Türk Lirası'nın zayıf seyrini sürdürüyor. Fed'in faiz kararı sonrası, piyasalarda ABD'deki istihdam piyasasının ılımlı bir yavaşlama gösterdiği yönündeki algı, dolar üzerinde baskı yaratuyor. Bu durum, paritenin 34,08 seviyesinde işlem görmesini destekliyor. Jeopolitik ve ekonomik belirsizlikler, Türk Lirası'nın gücünü sınırlandırıyor. Teknik analizde, 4 saatlik grafik zaman diliminde görülen ilk destek seviyeleri 33,96 ve 33,80, direnç seviyeleri ise 34,12 ve 34,22 olarak izleniyor. RSI göstergesi 56 seviyesinde, pozitif bir eğilim sergiliyor. USD/TRY paritesi, önceki güne kıyasla %0,0087'lik hafif bir yükselişle 34,07 seviyesinde bulunuyor. Özellikle 34,22 direncinin üzerine çıkılması, paritenin yukarı hareketlerini destekleyebilir. Destek:33.96 - 33.88 - 33.8 - Direnç:34.12 - 34.22 - 34.3 -

XAUUSD

Günlük Bülten

Gold continues to gain value due to the increase in global geopolitical risks and the weakening of the dollar index following statements from the Fed, BoE, and BoJ. The escalation of tensions by Israel on the Lebanese border particularly raises geopolitical risk perception, supporting the rise in precious metals. In the short term, Harker's FOMC speech might influence movements in gold prices. Remaining above the 2570 – 2580 support level, which is closely monitored, maintains the upward trend. Otherwise, movements towards the 2560 and 2550 levels might be observed. In the 1-hour timeframe, the XAU/USD price is trading above the 2580.41 resistance level and is at 2592.65. Support levels are being monitored at 2573.24 and 2558.03. The RSI indicator is at 61.64, showing a positive outlook. Compared to the previous day, the price has changed by 0.04%. Gold maintains its upward trend from a technical perspective and has the potential to reach the 2600 resistance level. Support:2580 - 2570 - 2560 - Resistance:2600 - 2610 - 2620 -

Ons altın, küresel anlamda jeopolitik risklerin artması ve Fed, BoE ve BoJ beyanatlarının ardından dolar endeksindeki zayıflama sonucu değer kazanmaya devam ediyor. Özellikle İsrail’in Lübnan sınırında gerilimi artırması, jeopolitik risk algısını yükseltirken, değerli metalde yükselişi destekliyor. Kısa vadede Harker’ın FOMC konuşması altındaki hareketleri etkileyebilir. Ons altının takip edildiği seviye olan 2570 – 2580 destek bölgesinin üzerinde kalmaya devam etmesi, yukarı yönlü eğilimi koruyor. Aksi durumda 2560 ve 2550 seviyelerine yönelimler gözlenebilir. 1 saatlik zaman diliminde XAU/USD fiyatı 2580.41 direnç seviyesini aşarak işlem görüyor ve 2592.65 seviyesinde bulunuyor. Destek olarak 2573.24 ve 2558.03 seviyeleri izleniyor. RSI göstergesi 61.64 seviyesinde, pozitif bir görünüm sergiliyor. Önceki güne göre fiyat yüzde 0.04 oranında değişmiş durumda. Ons altın, teknik açıdan yukarı yönlü eğilimini sürdürüyor ve 2600 direncine doğru potansiyel taşıyor. Destek:2580 - 2570 - 2560- Direnç:2600 - 2610 - 2620 -

WTIUSD

Günlük Bülten

The WTIUSD pair is on an upward trend due to the Fed's 50 basis point interest rate cut and rising risks in the Middle East. In global markets, the positive trend in Asian indices and the potential impacts of economic indicators in the U.S. are being monitored. Particularly, the Bank of Japan's decision to make no changes and developments in U.S. employment data may influence the course of oil prices. Uncertainties regarding the Fed's next interest rate move are noteworthy in the markets. Technically, WTIUSD is trading on the hourly chart and is currently at the 71.959 level. In upward movements, the resistance levels of 71.50 and 72.00 may be tested. In downward movements, the support levels of 70.78 and 70.44 can be monitored. The RSI indicator is at the 56.24 level, and the market presents a positive outlook. The percentage change compared to the previous day is -0.08%. Pricing continues to move between the specified support and resistance areas. Support:70.5 - 70 - 69.5 - Resistance:71.5 - 72 - 72.5

WTIUSD paritesi, Fed'in gerçekleştirdiği 50 baz puanlık faiz indirimi ve Orta Doğu'da artan risklerin etkisiyle yükseliş eğiliminde. Küresel piyasalarda Asya endekslerindeki pozitif seyir ve ABD'deki ekonomik göstergelerin olası etkileri takip ediliyor. Özellikle Japonya Merkez Bankası'nın değişiklik yapmaması ve ABD istihdam verilerindeki gelişmeler, petrol fiyatlarının seyrinde etkili olabilir. Piyasalarda Fed’in bir sonraki faiz adımına dair belirsizlikler ise dikkat çekiyor. Teknik olarak, WTIUSD bir saatlik grafikte işlem görmekte olup, şu an 71.959 seviyelerinde bulunuyor. Yukarı yönlü hareketlerde 71.50 ve 72.00 direnç seviyeleri test edilebilir. Aşağı yönlü hareketlerde ise 70.78 ve 70.44 destek seviyeleri izlenebilir. RSI göstergesi 56.24 seviyesinde ve piyasa pozitif bir görünüm sergiliyor. Önceki güne göre değişim yüzdesi -0.08% düzeyinde gerçekleşmiştir. Fiyatlamalar, belirtilen destek ve direnç bölgeleri arasında hareketini sürdürmeye devam ediyor. Destek:70.5 - 70 - 69.5 - Direnç:71.5 - 72 - 72.5 -

BRNUSD

Günlük Bülten

Brent crude oil is showing a strong pricing trend with the Federal Reserve’s 50 basis point interest rate cut and increasing risks in the Middle East. As oil approaches its fastest weekly rise since April, maintaining the support levels of 73.00 – 73.50 is important for the continuation of upward potential. In international markets, the positive trend in Asian indexes is noteworthy, which could indirectly support oil. Technically, Brent crude prices are examined on an hourly chart. While the support level at 73.31 is monitored, 75.50 and 76.00 are tracked as upward resistance levels. The RSI indicator is at 55.71, indicating a positive outlook. On a daily basis, the price has decreased by 0.09% to 73.87. As long as it stays above the current support zones, there is a possibility for oil prices to continue their upward trend. Support:74 - 73.5 - 73 - Resistance:75 - 75.5 - 76 -

Brent petrol, Fed’in gerçekleştirdiği 50 baz puanlık faiz indirimi ve Orta Doğu’daki artan risklerle birlikte güçlü bir fiyatlama eğilimi gösteriyor. Haftalık bazda Nisan ayından bu yana en hızlı yükselişini gerçekleştirmeye yaklaşan petrolün fiyatlamasında, 73,00 – 73,50 destek seviyelerinin korunması, yukarı yönlü potansiyelin devamı açısından önem taşıyor. Uluslararası piyasalarda ise Asya endekslerindeki pozitif seyir dikkat çekiyor, bu da petrol üzerinde dolaylı bir destek unsuru olabilir. Teknik açıdan, Brent petrol fiyatları saatlik grafikte inceleniyor. 73,31 seviyesindeki destek noktası izlenirken, yukarı yönlü direnç seviyeleri olarak 75,50 ve 76,00 takip ediliyor. RSI göstergesi 55,71 seviyesinde olup, pozitif bir görünüme işaret ediyor. Günlük bazda fiyatı %0,09 gerileyerek 73,87 seviyesinde yer alıyor. Mevcut destek bölgelerinin üzerinde kalındıkça, petrol fiyatlarının yukarı yönlü seyrini sürdürme ihtimali bulunuyor. Destek:74 - 73.5 - 73 - Direnç:75 - 75.5 - 76

NDXUSD

Günlük Bülten

The NASDAQ 100 continues its rise following the Fed's 50 basis points rate cut. The index gained upward momentum with a recovery led by U.S. technology stocks. The strong performance of mega-cap tech firms like Nvidia, Tesla, Apple, Meta, and AMD contributed to the overall positive trend of the index. Markets are following FOMC member Harker's speech today. Signals of easing in the U.S. labor market create a positive atmosphere in Asian indices, while U.S. index futures are experiencing a slight pullback. The chart is shown in a 1-hour time frame. The index is trading above the 19800 – 19900 support zone during the day. It is supported by the 21-period exponential moving average around the 19838 level. In upward movements, the 20150 and 20250 levels are monitored as resistance. The RSI indicator is at 57.51, exhibiting a positive outlook, indicating that the rise may continue. However, a partial loss of 0.08% compared to the previous day has been observed. The NASDAQ 100 is trading at the level of 19803. Support:20000 - 19900 - 19800 Resistance:20150 - 20250 -20350 -

NASDAQ 100, Fed’in 50 baz puanlık faiz indirimi sonrasında yükselişini sürdürüyor. ABD teknoloji hisse senetlerinin başını çektiği bir toparlanma ile endeks yukarı yönlü ivme kazandı. Özellikle Nvidia, Tesla, Apple, Meta ve AMD gibi mega-cap teknoloji firmalarının güçlü performans göstermesi, endeksin genel pozitif seyrine katkıda bulundu. Piyasalar bugün FOMC üyesi Harker’ın konuşmasını takip ediyor. ABD iş gücü piyasasındaki yumuşama sinyalleri, Asya endekslerinde olumlu bir hava yaratırken, ABD endeks vadelileri ise hafif bir geri çekilme içinde. Grafik 1 saatlik zaman diliminde gösterilmektedir. Endeks, gün içerisinde 19800 – 19900 destek bölgesi üzerinde işlem görüyor. 19838 seviyesi civarındaki 21 periyotluk üstel hareketli ortalama tarafından desteklenmekte. Yukarı yönlü hareketlerde 20150 ve 20250 seviyeleri direnç olarak izleniyor. RSI göstergesi 57.51 ile pozitif bir görünümdedir, bu da yükselişin devam edebileceğine işaret ediyor. Ancak önceki güne göre %0.08'lik kısmi bir değer kaybı gözlenmiştir. NASDAQ 100, 19803 seviyesinde işlem görmektedir. Destek:20000 - 19900 - 19800 Direnç:20150 - 20250 - 20350 -

DAXEUR

Günlük Bülten

The DAX 40 index experienced a volatile course this week in line with the monetary policy decisions and expectations of central banks in global markets, while European stock indices are generally preparing for an optimistic weekly close. It is noteworthy that, along with the indices of France and Spain, the DAX 40 showed a 1.60% increase. After reaching a new peak at the level of 19224, the index experienced partial pullbacks. The upcoming period will be quite data-driven, and this situation may create speculative effects on stock indices. From a technical analysis perspective, the DAX 40 index, examined on a 1- hour timeframe, maintains the importance of the 18965 – 19040 region, and it may continue its upward trend above these levels. Currently trading at around 18919, if the upward momentum continues, resistance levels at 19225, 19300, and 19395 can be monitored. The RSI indicator is at the level of 48.66, showing a neutral trend. It is noteworthy that the index fell by 0.08% compared to the previous day, while persistent movements below the 18965 – 19040 region could lead to reaction formations. Support:19040 - 18965 - 18885 - Resistance:19225 - 19300 - 19395

DAX 40 endeksi, bu hafta küresel piyasalarda merkez bankalarının para politikası kararları ve beklentileri doğrultusunda dalgalı bir seyir izlerken, Avrupa borsa endeksleri genel olarak iyimser bir hafta kapanışı yapmaya hazırlanıyor. Avrupa'da Fransa ve İspanya’nın endeksleriyle beraber DAX 40’ın da %1,60 oranında yükseliş göstermesi dikkat çekiyor. Endeks, 19224 seviyesinde yeni bir zirve gördükten sonra kısmi geri çekilmelere maruz kaldı. Önümüzdeki süreç oldukça veri odaklı olacak ve bu durum, borsa endeksleri üzerinde spekülatif etkiler yaratabilir. Teknik analiz açısından, 1 saatlik zaman diliminde incelenen DAX 40 endeksi, 18965 – 19040 bölgesi önemini koruyarak, bu seviyelerin üzerinde yükseliş eğilimini sürdürebilir. Şu an 18919 seviyelerinde işlem gören endekste yukarı yönlü ivmenin devam etmesi durumunda, 19225, 19300 ve 19395 direnç seviyeleri takip edilebilir. RSI göstergesi 48,66 seviyesinde ve nötr bir eğilim gösteriyor. Endeksin önceki güne göre %0,08 gerilemesi dikkat çekerken, 18965 – 19040 bölgesinin altındaki kalıcı hareketler tepki oluşumlarına öncülük edebilir. Destek:19040 - 18965 - 18885 - Direnç:19225 - 19300 - 19395

NGCUSD

Günlük Bülten

In the US natural gas market, a recovery is observed due to expectations of rising temperatures despite the pressure from a larger-than-expected increase in inventories. Pricing managed to stay above the 2.275-2.300 support levels, in line with the trend of European and US exchanges. This situation maintains the upward outlook, with potential targets at the 2.380 and 2.410 levels in case of further increases. However, for tracking developments that could lead to deeper declines, breaking the 2.275 level and having 4-hour closings below this level could be an important indicator. Looking at the chart in the hourly time frame, natural gas prices are trying to hold at current levels. The price at the 2.315 level is above the 2.280 and 2.232 support levels, with the 2.380 level monitored as resistance. The RSI indicator is at 60.85 and shows a positive trend. This may imply that the upward momentum in the markets could continue. The current price is at the 2.315 level, showing a limited increase compared to the previous day. Support:2.335 - 2.3 - 2.275 - Resistance:2.38 - 2.41 - 2.44 -

ABD doğal gaz piyasasında, stoklarda beklenenden fazla artışın yarattığı baskıya karşın hava sıcaklıklarının yükseleceği beklentileri nedeniyle bir toparlanma gözlemleniyor. Fiyatlamalar, Avrupa ve ABD borsalarının seyrine paralel olarak 2,275-2,300 destek seviyelerinin üzerinde kalmayı başardı. Bu durum, yukarı yönlü görünümün devamını sağlarken, olası yükselişlerde 2,380 ve 2,410 seviyelerinin hedeflenebileceği belirtiliyor. Ancak, düşüşlerin daha dip seviyelere inmesine neden olabilecek gelişmelerin takip edilebilmesi için, 2,275 seviyesinin kırılarak 4 saatlik kapanışların bu seviyenin altında gerçekleşmesi önemli bir gösterge olabilir. Grafiğe saatlik zaman diliminde bakıldığında, doğal gaz fiyatları mevcut seviyelerde tutunmaya çalışıyor. 2,315 seviyesindeki fiyat, 2,280 ve 2,232 destek seviyelerinin üzerindeyken, direnç olarak 2,380 seviyesi izleniyor. RSI göstergesi 60,85 seviyesinde ve pozitif bir eğilim sergiliyor. Bu durum, piyasalarda yukarı yönlü ivmenin devam edebileceğini ima edebilir. Mevcut fiyat 2,315 seviyesinde seyrediyor, önceki güne göre sınırlı bir artış görülüyor. Destek:2.335 - 2.3 - 2.275 - Direnç:2.38 - 2.41 - 2.44 -