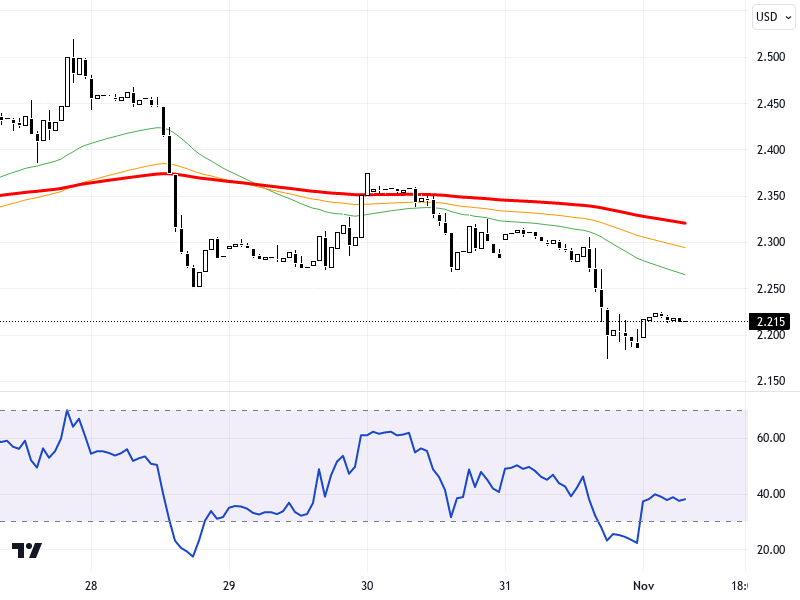
NGCUSD
The NGC/USD pair is moving towards 3 dollars, supported by weather forecasts, ahead of upcoming U.S. natural gas futures inventory data. The performance of European and U.S. markets, along with the inventory numbers to be announced by the U.S. Energy Information Administration, could be decisive for the direction of the pair. Particularly, the upward outlook can be maintained as long as it stays above the 2.880 – 2.910 support levels. However, in a potential downside scenario, closures below the 2.880 level should be monitored. In this case, the 2.850 and 2.820 levels might come into focus.
Technically, on the daily chart, the pair is moving toward the 2.75 resistance level, with 2.675, 2.65, and 2.61 levels being monitored as support. The RSI indicator is at 30, exhibiting a negative trend, indicating that it is in the oversold region and the likelihood of a short-term recovery is low. In the last 24 hours, the pair has increased by 1.33%, yet it suggests that caution is needed in the overall outlook.
Support :
Resistance :


