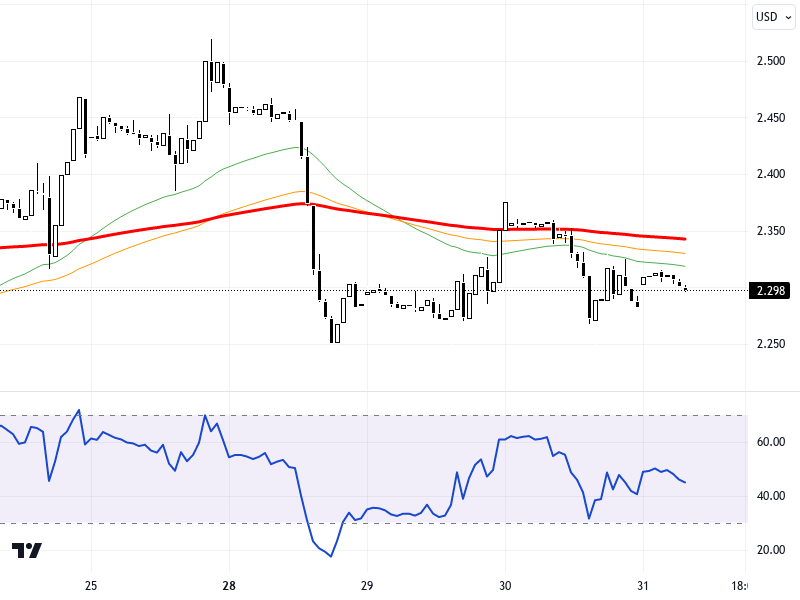
NGCUSD
U.S. natural gas futures are on an upward trend, supported by upcoming inventory data and weather forecasts. Movements in European and U.S. markets, as well as inventory figures to be announced by the U.S. Energy Information Administration, could be decisive in pricing direction. In global markets, there's a mixed outlook due to pressure in the chip sector in Asia and the impact of economic data in the U.S. Especially significant economic indicators to be announced in the U.S. may cause fluctuations in the markets.
Technically, in the daily NGCUSD chart, the levels of 2.78, 2.75, and 2.72 can be monitored as support. In upward movements, the levels of 2.85, 2.88, and 2.91 stand out as resistance. The RSI indicator is at the 50 level, showing a neutral outlook. It is observed that the pair is following a slightly positive trend with a 0.61% rise compared to the previous day. Current price movements and technical indicators suggest that the pair might test certain resistance levels; however, a stronger momentum could be gained if a breakout occurs.
Support :
Resistance :


