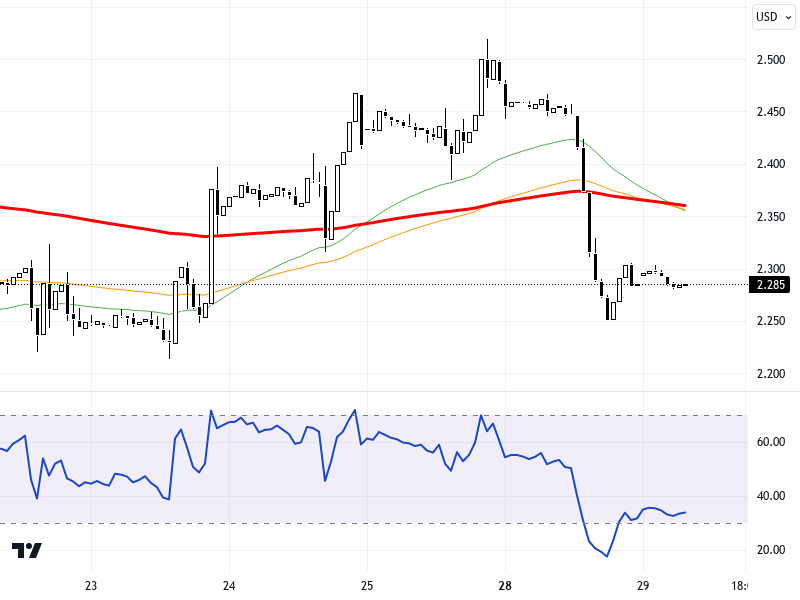
NGCUSD
NGCUSD is in search of direction ahead of the release of stock figures, along with data on consumer confidence and job openings in the US, as well as the impact of weather forecasts. Markets are focused on the upcoming US elections and the Fed's monetary policy statement. A mixed trend is observed in Asian indices, which further increases uncertainty regarding natural gas prices. The strengthening trend in the dollar might pressure natural gas prices, while developments in the energy sector and demand expectations influenced by weather conditions are affecting valuations.
Technically, on the NGCUSD chart in the 4-hour time frame, the resistance levels of 2.88 – 2.91 stand out. In downward movements, the support levels of 2.78, 2.75, and 2.72 can be monitored. The RSI indicator is at level 45, showing a negative trend. This may indicate short-term pressure on prices. A slight decline is observed compared to yesterday's close, and the price is trading at the level of 2.285. In this context, whether the price remains above the 2.78 support could be decisive in determining direction.
Support :
Resistance :


