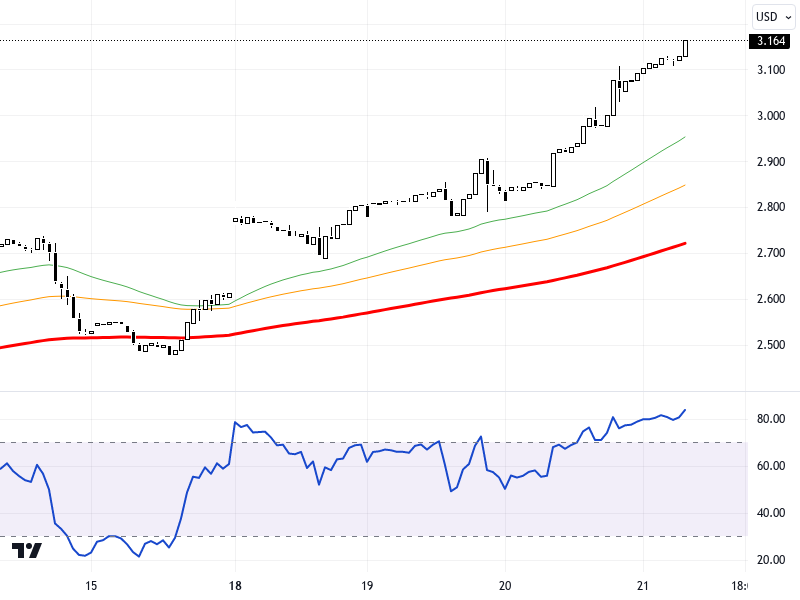
NGCUSD
U.S. natural gas futures gained significant value due to cold weather forecasts for the end of November. The expectation of temperatures below seasonal norms increases natural gas demand, exerting upward pressure on prices. The course of European and U.S. markets, along with the inventory data to be released by the U.S. Energy Information Administration, are among the factors to be closely monitored in the markets. Global geopolitical developments, such as geopolitical risks and U.S.-China relations, also create fluctuations in energy markets.
From a technical perspective, the NGCUSD pair is trading above the 3.33 - 3.37 support levels on the daily chart. As long as it remains above these levels, upward movements are expected to continue. In upward movements, 3.44, 3.50, and 3.535 resistance levels can be observed. The RSI indicator is at 49, showing a neutral outlook. A rise of 1.93% compared to the previous day is noteworthy in the pair. In case of possible pullbacks, the 3.4 and 3.37 support levels should be monitored; if hourly closings are seen below the 3.33 level, the potential for a decline may increase.
Support :
Resistance :


